Documentation Index
Fetch the complete documentation index at: https://docs.helix-db.com/llms.txt
Use this file to discover all available pages before exploring further.
For the complete documentation index optimized for AI agents, see llms.txt.
At HelixDB we’ve been focused on performance for the last few weeks. Here are our benchmarks for HelixDB, Neo4j, and Postgres (edges as joins) on a realistic graph dataset.
We’re still working on Vector benchmarks - stay tuned!
TL;DR
(10,000 users, 500,000 items, ~4M edges).
- HelixDB crushes graph workloads (5-20x faster) and is your best bet for production graph workloads (GraphRAG, recommendations, social graphs)
- Neo4j 5-20x slower than HelixDB
- Postgres is 10-80x slower
Dataset hash ffed7c34a46dc90e · Conducted November 2025 · Raw data in repo
How to Read This
| Term | Meaning |
|---|
| P50 / P95 / P99 | 50th / 95th / 99th percentile latency |
| ops/sec | Successful operations per second (throughput) |
| FixedConcurrency | Sustained load at N concurrent clients |
| FixedQPS | Constant request rate, measures latency stability |
Test Environment
Hardware: AWS c6g.2xlarge (eu-west-2) · 8 vCPUs (ARM Neoverse-N1) · 16 GB RAM · 500 GB gp3 EBS
Software: Ubuntu 24.04 LTS · HelixDB v2.1.0 · Neo4j 2025.09.0 (G1GC) · PostgreSQL 16.10
Benchmark: 2s warmup · 5s measurement window · FixedConcurrency (100/200/400/800) + FixedQPS (400/800/1600)
Dataset: 10k users across 25 countries · 500k items across 1k categories · ~4M edges (~400/user)
Workloads Tested
| ID | Name | Description | Example Use |
|---|
| 1 | PointGet | Retrieve entity by ID | Product detail fetch |
| 2 | OneHop | Traverse all user -> item edges | Watch history |
| 3 | OneHopFilter | Traverse + filter by category | ”Action movies watched” |
Results Summary
| Workload | Raw Winner | Performance Gap |
|---|
| PointGet | HelixDB | 12x Postgres, 16x Neo4j |
| OneHop | HelixDB | 5.9x Neo4j, 13x Postgres |
| OneHopFilter | HelixDB | 4.2x Neo4j, 20x Postgres |
Detailed Results
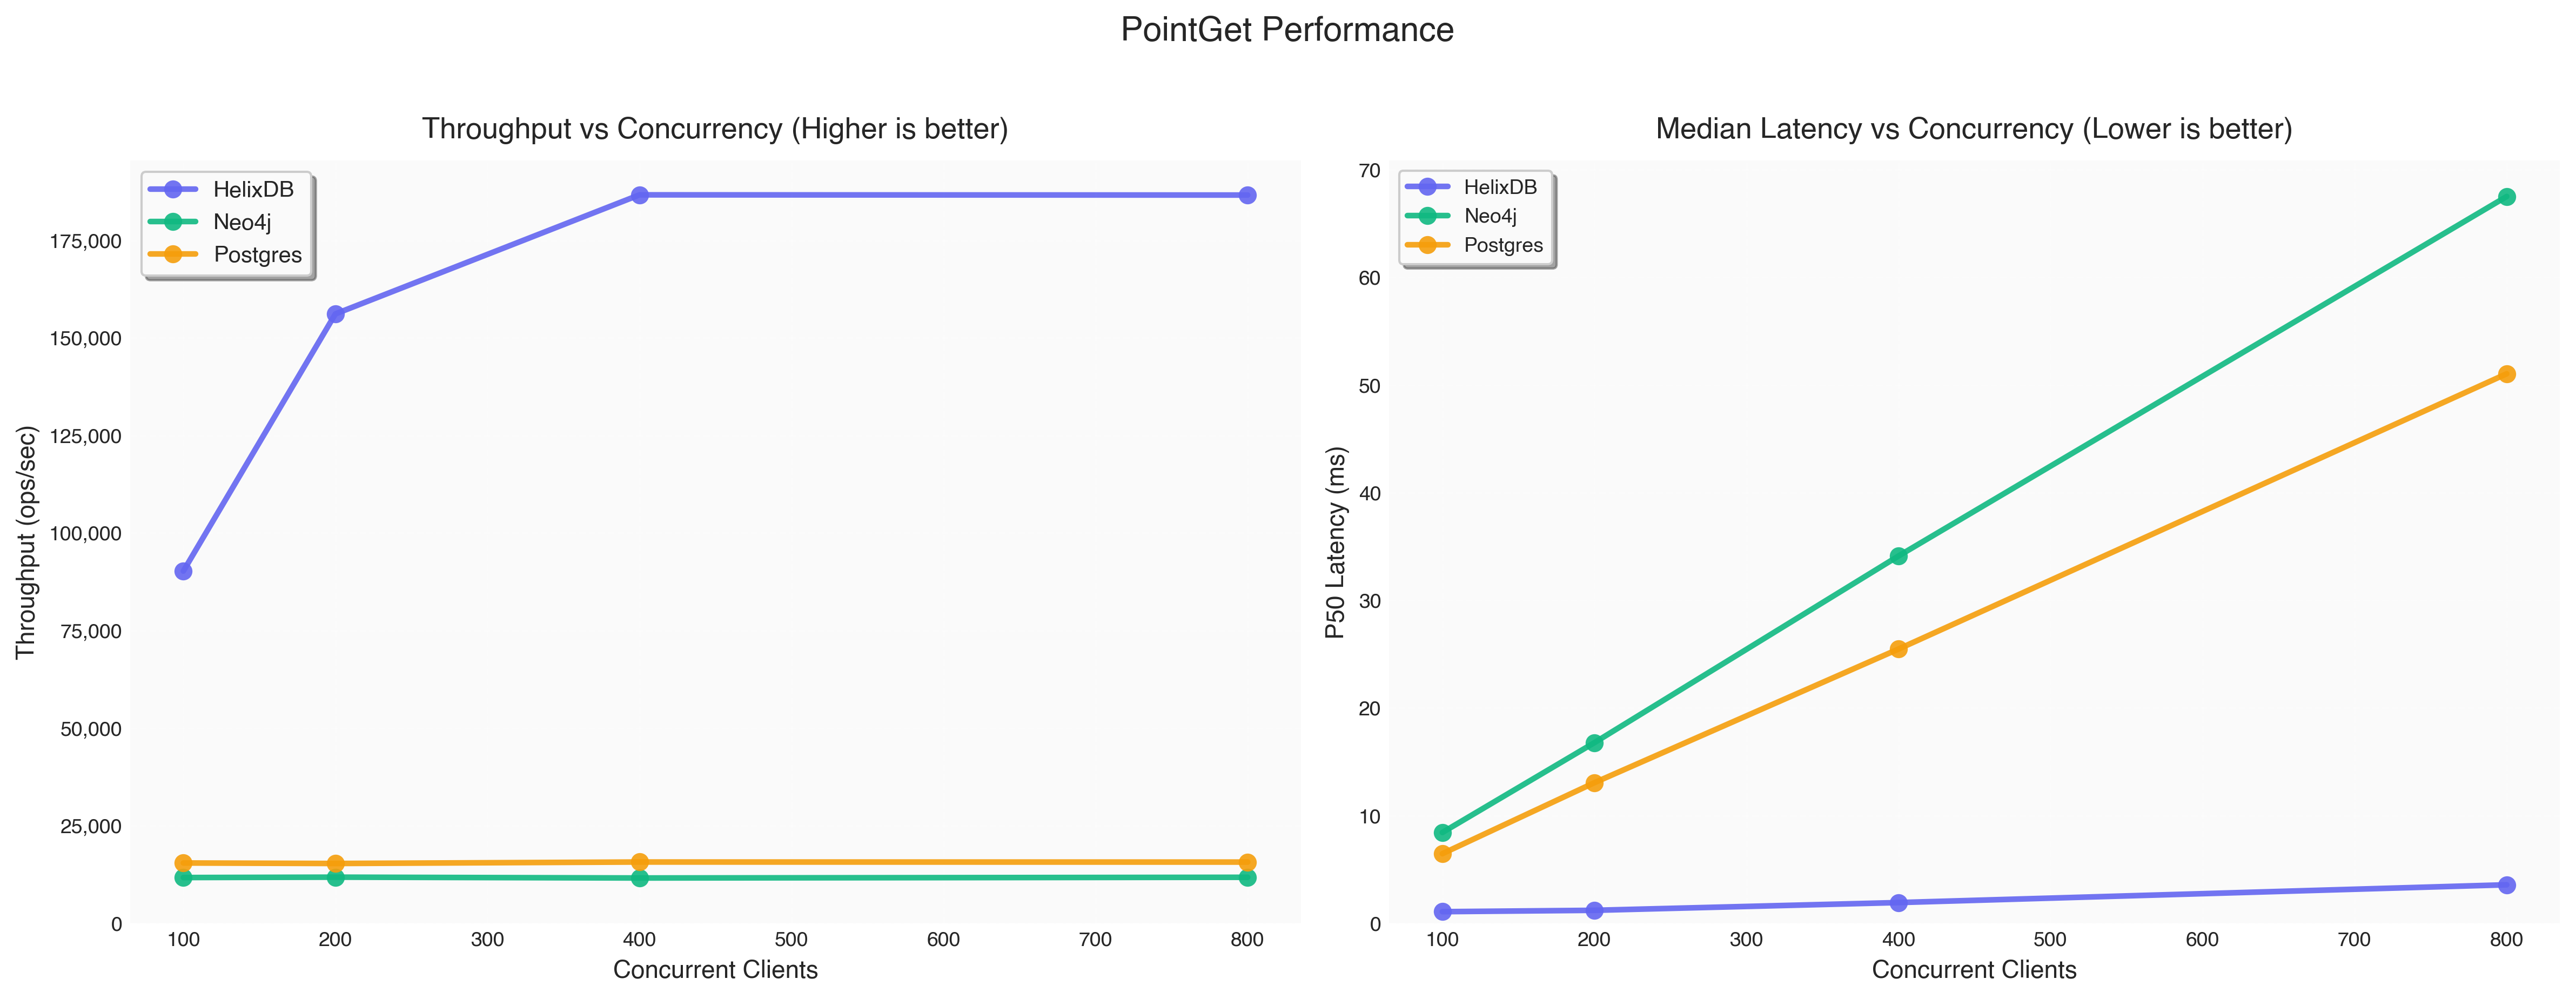
1 · PointGet — Simple ID Lookup
Retrieve single item by ID (product detail, user profile).
Winner: HelixDB — 12x Postgres, 16x Neo4j
FixedConcurrency Results
| Database | Concurrency | Throughput (ops/sec) | P50 Latency (ms) | P95 Latency (ms) | P99 Latency (ms) |
|---|
| HelixDB | 100 | 90,238.4 | 1.07 | 1.29 | 1.41 |
| Neo4j | 100 | 11,706.0 | 8.43 | 9.11 | 11.30 |
| Postgres | 100 | 15,435.0 | 6.46 | 6.61 | 6.71 |
| HelixDB | 200 | 156,136.0 | 1.20 | 1.62 | 1.94 |
| Neo4j | 200 | 11,802.0 | 16.77 | 18.72 | 19.78 |
| Postgres | 200 | 15,307.4 | 13.05 | 13.34 | 13.47 |
| HelixDB | 400 | 186,642.4 | 1.92 | 2.81 | 3.44 |
| Neo4j | 400 | 11,592.2 | 34.12 | 37.61 | 38.86 |
| Postgres | 400 | 15,685.6 | 25.47 | 25.86 | 26.16 |
| HelixDB | 800 | 186,590.8 | 3.57 | 6.73 | 8.62 |
| Neo4j | 800 | 11,771.8 | 67.52 | 70.90 | 71.72 |
| Postgres | 800 | 15,670.2 | 51.05 | 51.95 | 52.94 |
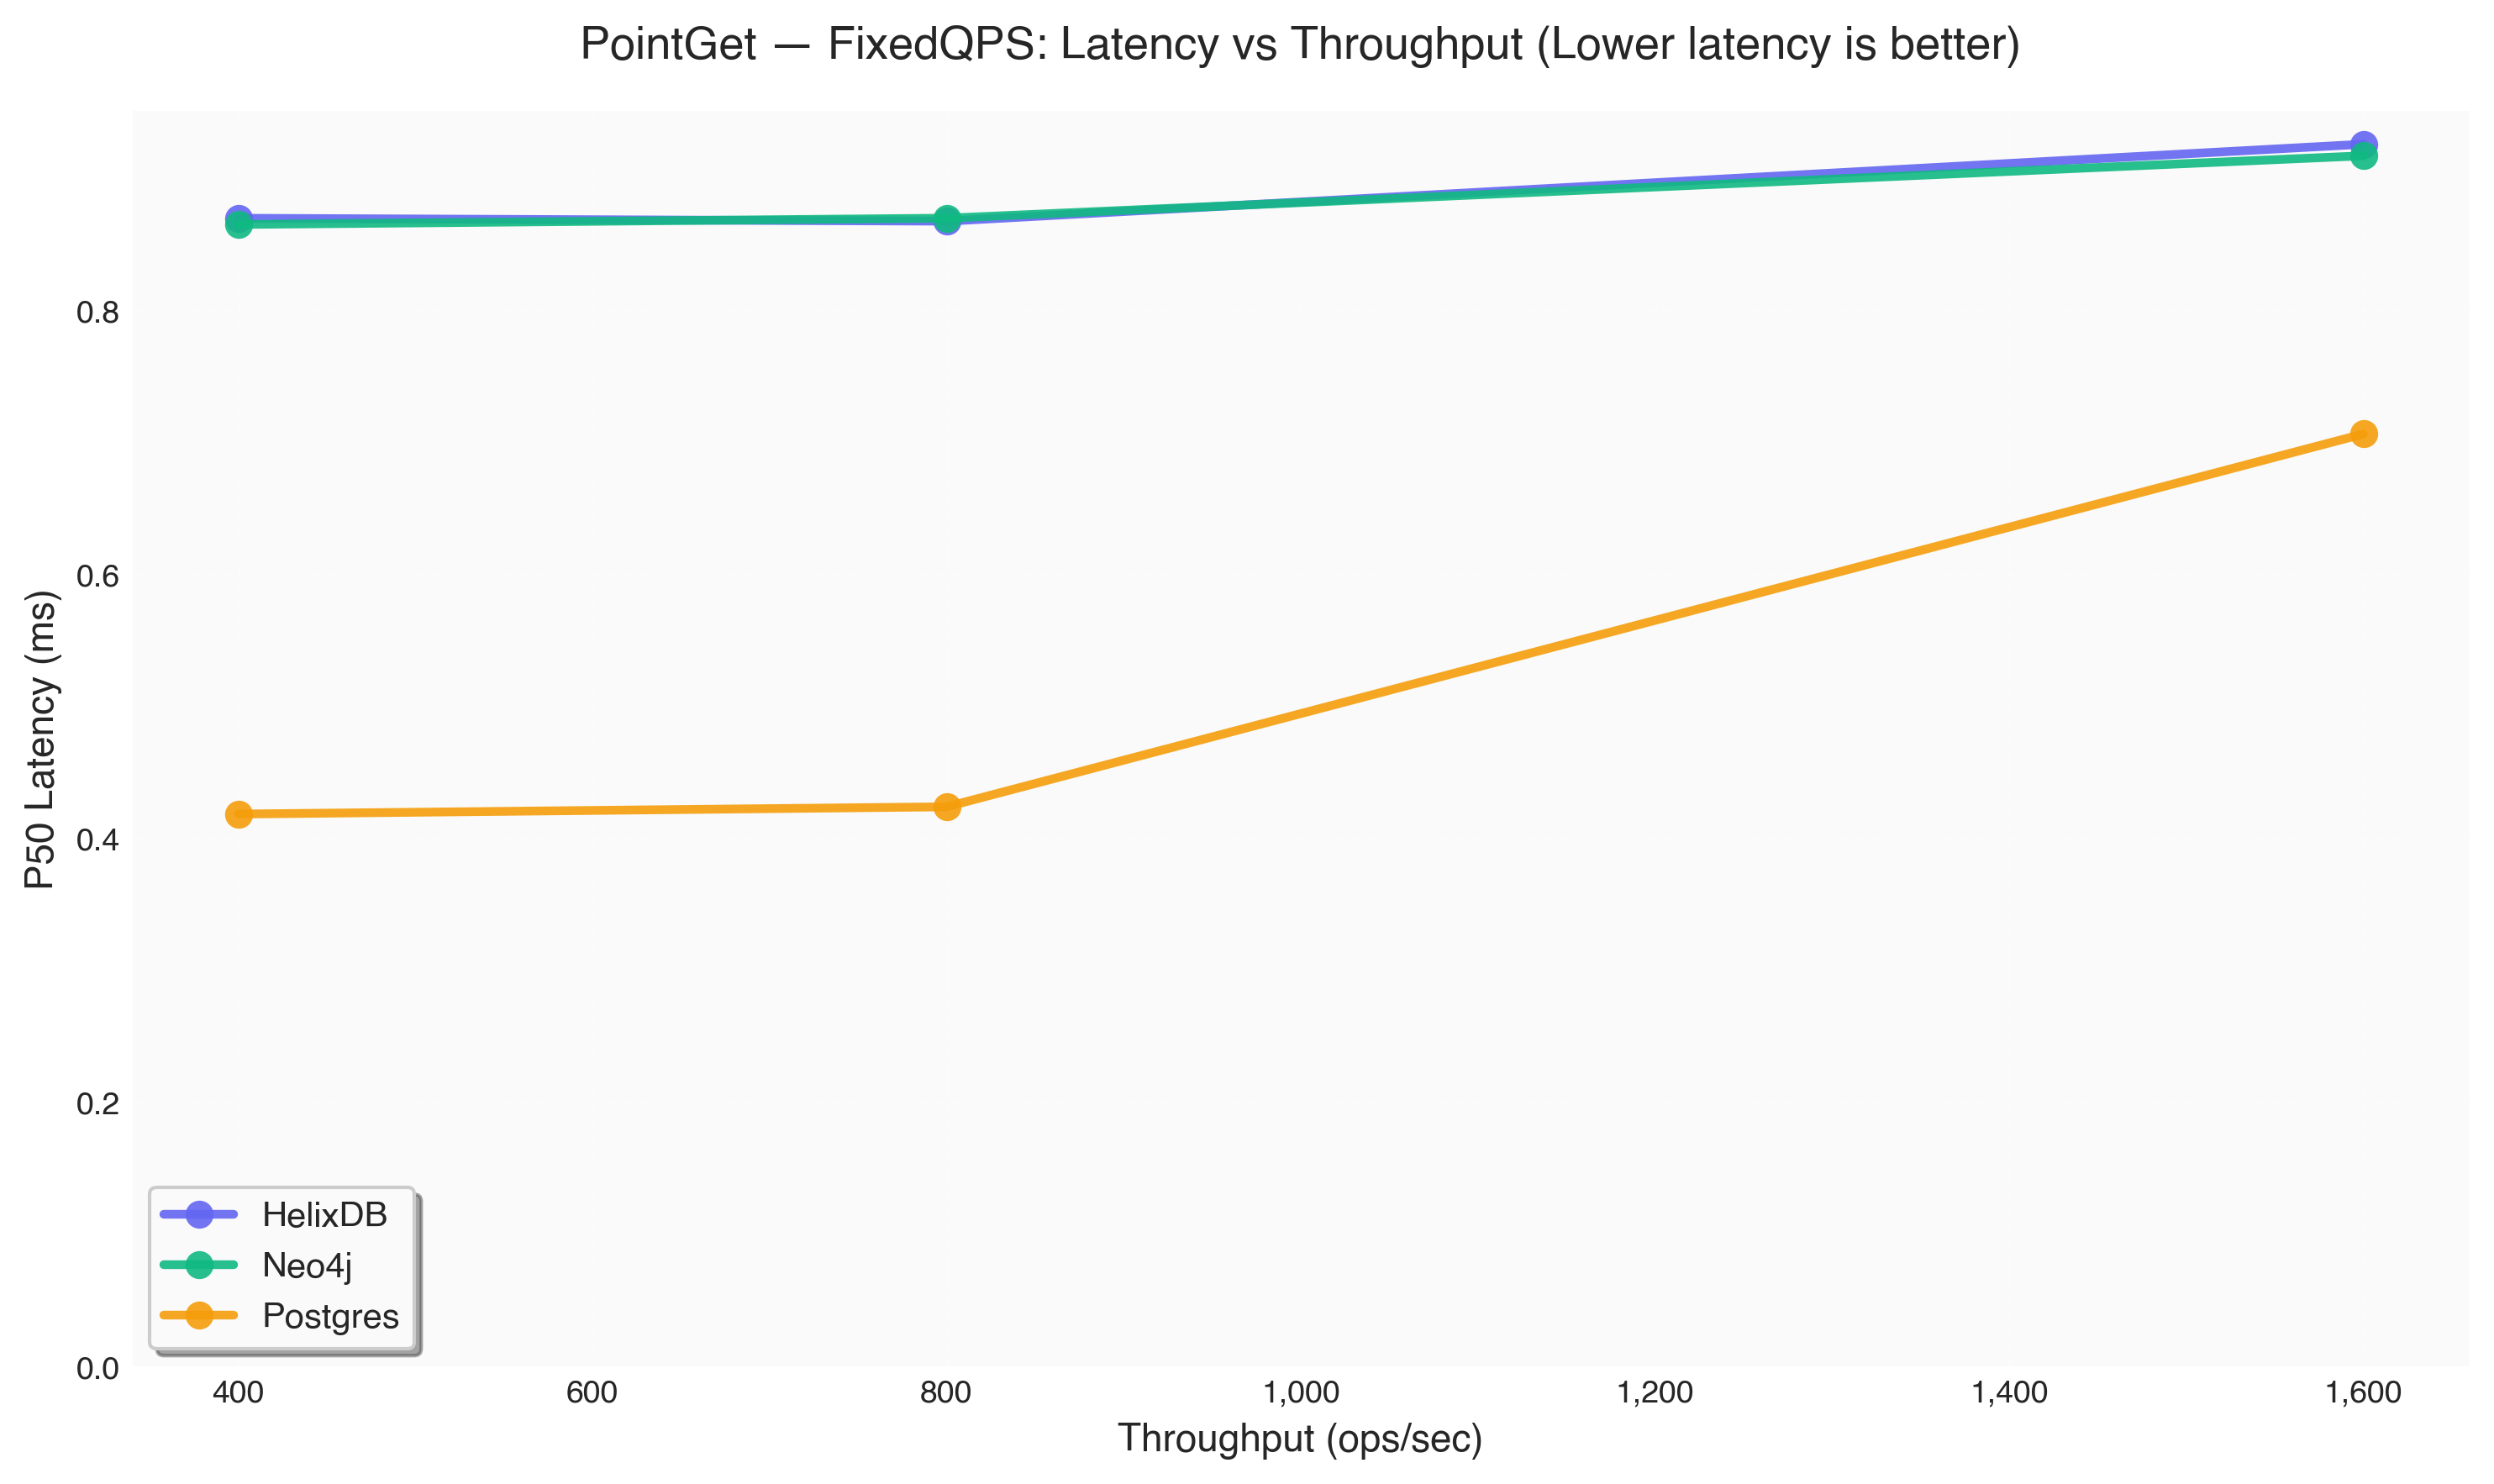
FixedQPS Results
| Database | Target QPS | Actual Throughput (ops/sec) | P50 Latency (ms) | P95 Latency (ms) | P99 Latency (ms) |
|---|
| HelixDB | 400 | 400.2 | 0.87 | 0.90 | 0.97 |
| Neo4j | 400 | 400.2 | 0.87 | 0.91 | 0.93 |
| Postgres | 400 | 400.2 | 0.42 | 0.44 | 0.46 |
| HelixDB | 800 | 800.2 | 0.87 | 0.90 | 0.96 |
| Neo4j | 800 | 800.2 | 0.87 | 0.94 | 0.97 |
| Postgres | 800 | 800.0 | 0.42 | 0.50 | 0.53 |
| HelixDB | 1600 | 1,600.0 | 0.93 | 0.99 | 1.10 |
| Neo4j | 1600 | 1,600.0 | 0.92 | 0.99 | 1.03 |
| Postgres | 1600 | 1,600.0 | 0.71 | 1.33 | 1.36 |
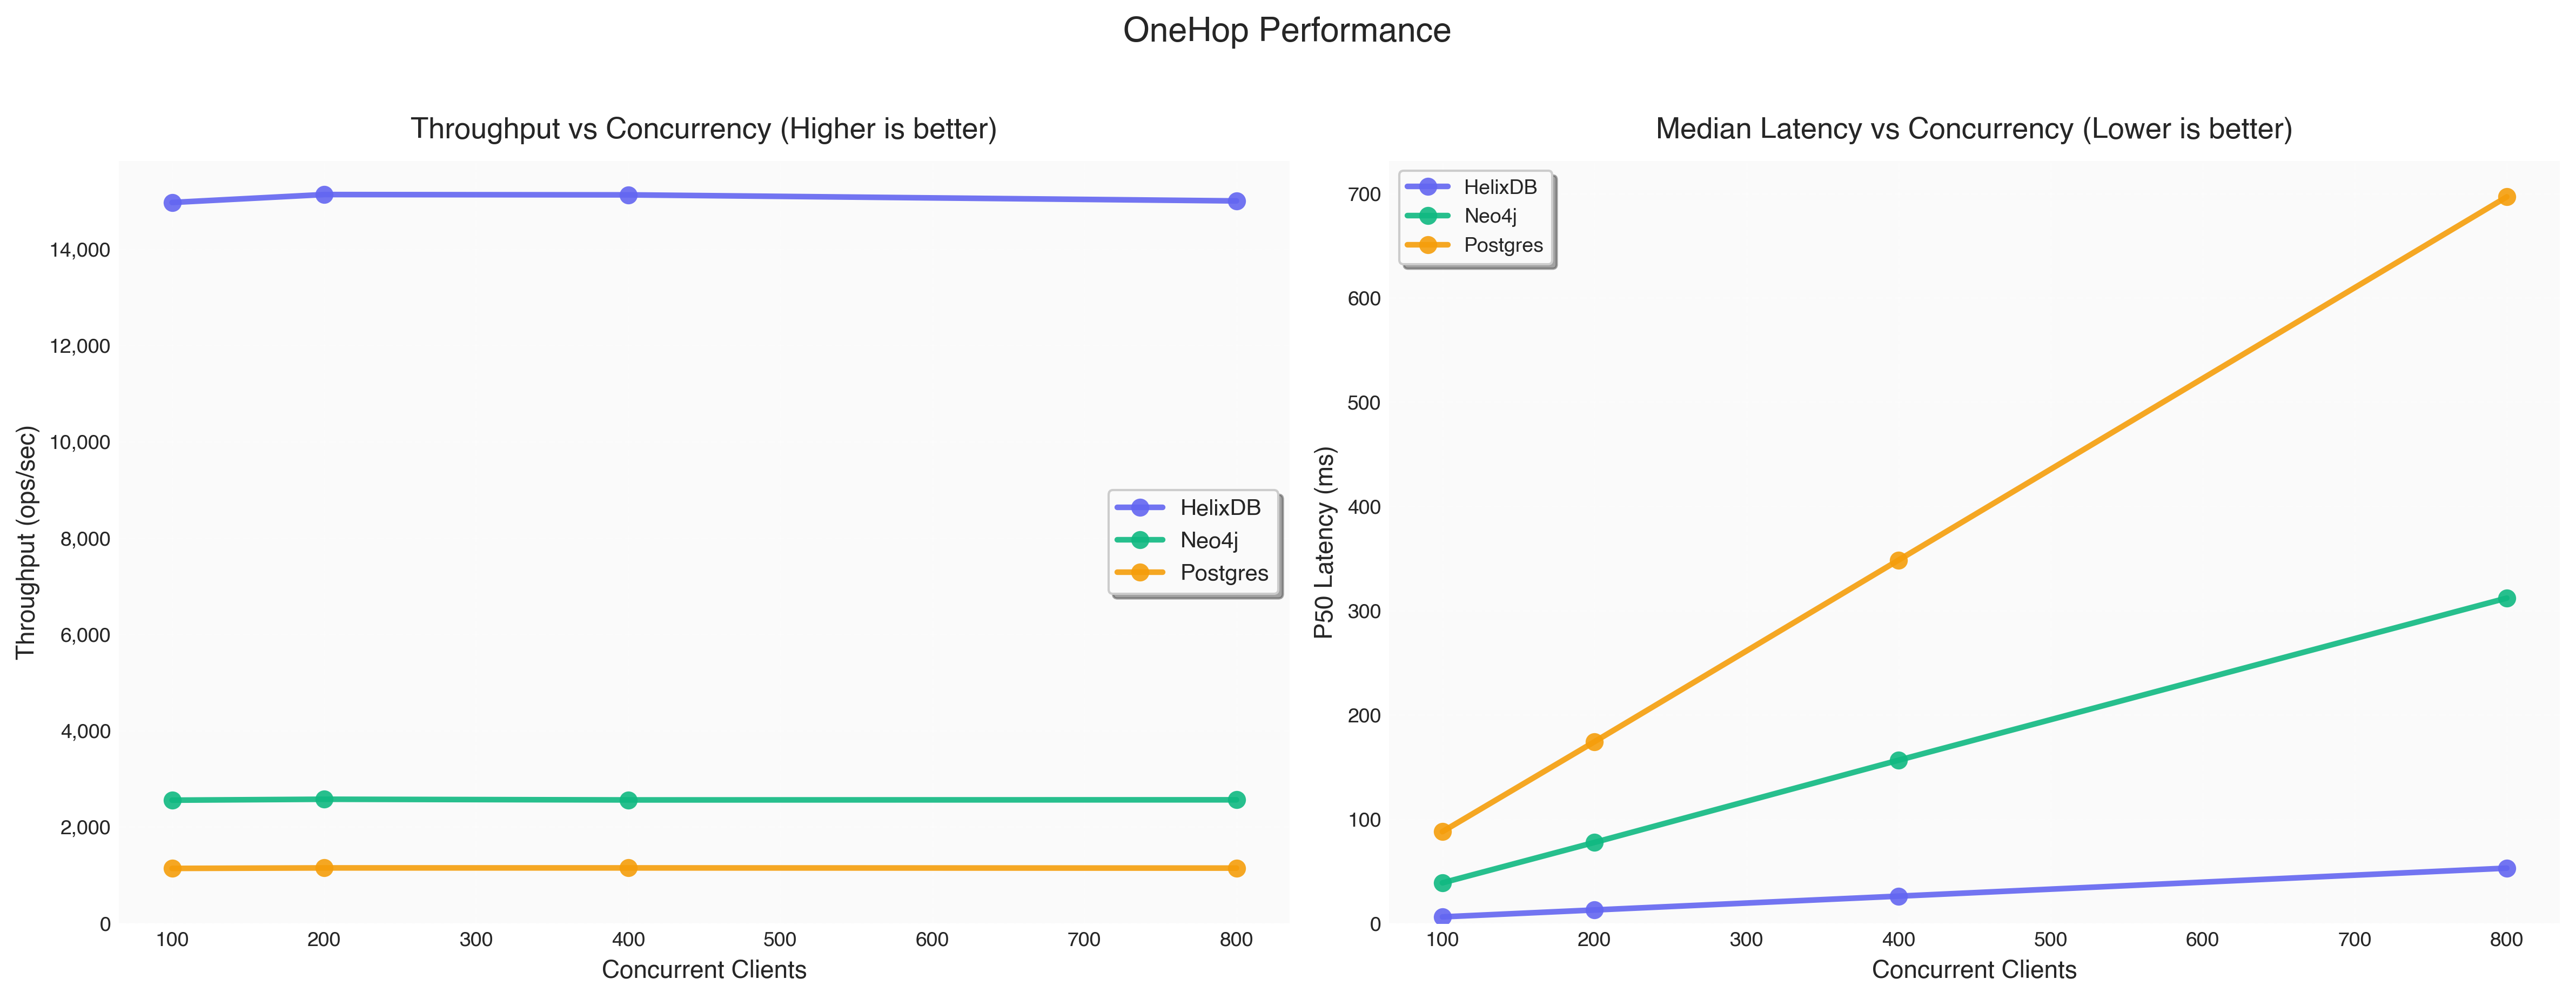
2 · OneHop — Graph Traversal
Fetch all items a user interacted with (~400 edges/user).
Winner: HelixDB — 5.9x Neo4j, 13x Postgres
FixedConcurrency Results
| Database | Concurrency | Throughput (ops/sec) | P50 Latency (ms) | P95 Latency (ms) | P99 Latency (ms) |
|---|
| HelixDB | 100 | 14,964.6 | 6.09 | 11.87 | 15.30 |
| Neo4j | 100 | 2,555.0 | 38.75 | 42.96 | 46.08 |
| Postgres | 100 | 1,138.2 | 87.84 | 89.38 | 90.38 |
| HelixDB | 200 | 15,129.2 | 12.72 | 18.74 | 22.21 |
| Neo4j | 200 | 2,574.0 | 77.53 | 81.04 | 82.36 |
| Postgres | 200 | 1,148.4 | 174.13 | 176.07 | 177.03 |
| HelixDB | 400 | 15,122.8 | 25.96 | 32.00 | 35.50 |
| Neo4j | 400 | 2,560.0 | 156.40 | 160.08 | 161.52 |
| Postgres | 400 | 1,148.4 | 348.39 | 350.02 | 351.22 |
| HelixDB | 800 | 14,996.8 | 52.84 | 58.88 | 62.44 |
| Neo4j | 800 | 2,562.2 | 311.93 | 317.19 | 318.83 |
| Postgres | 800 | 1,144.6 | 696.85 | 698.79 | 699.19 |
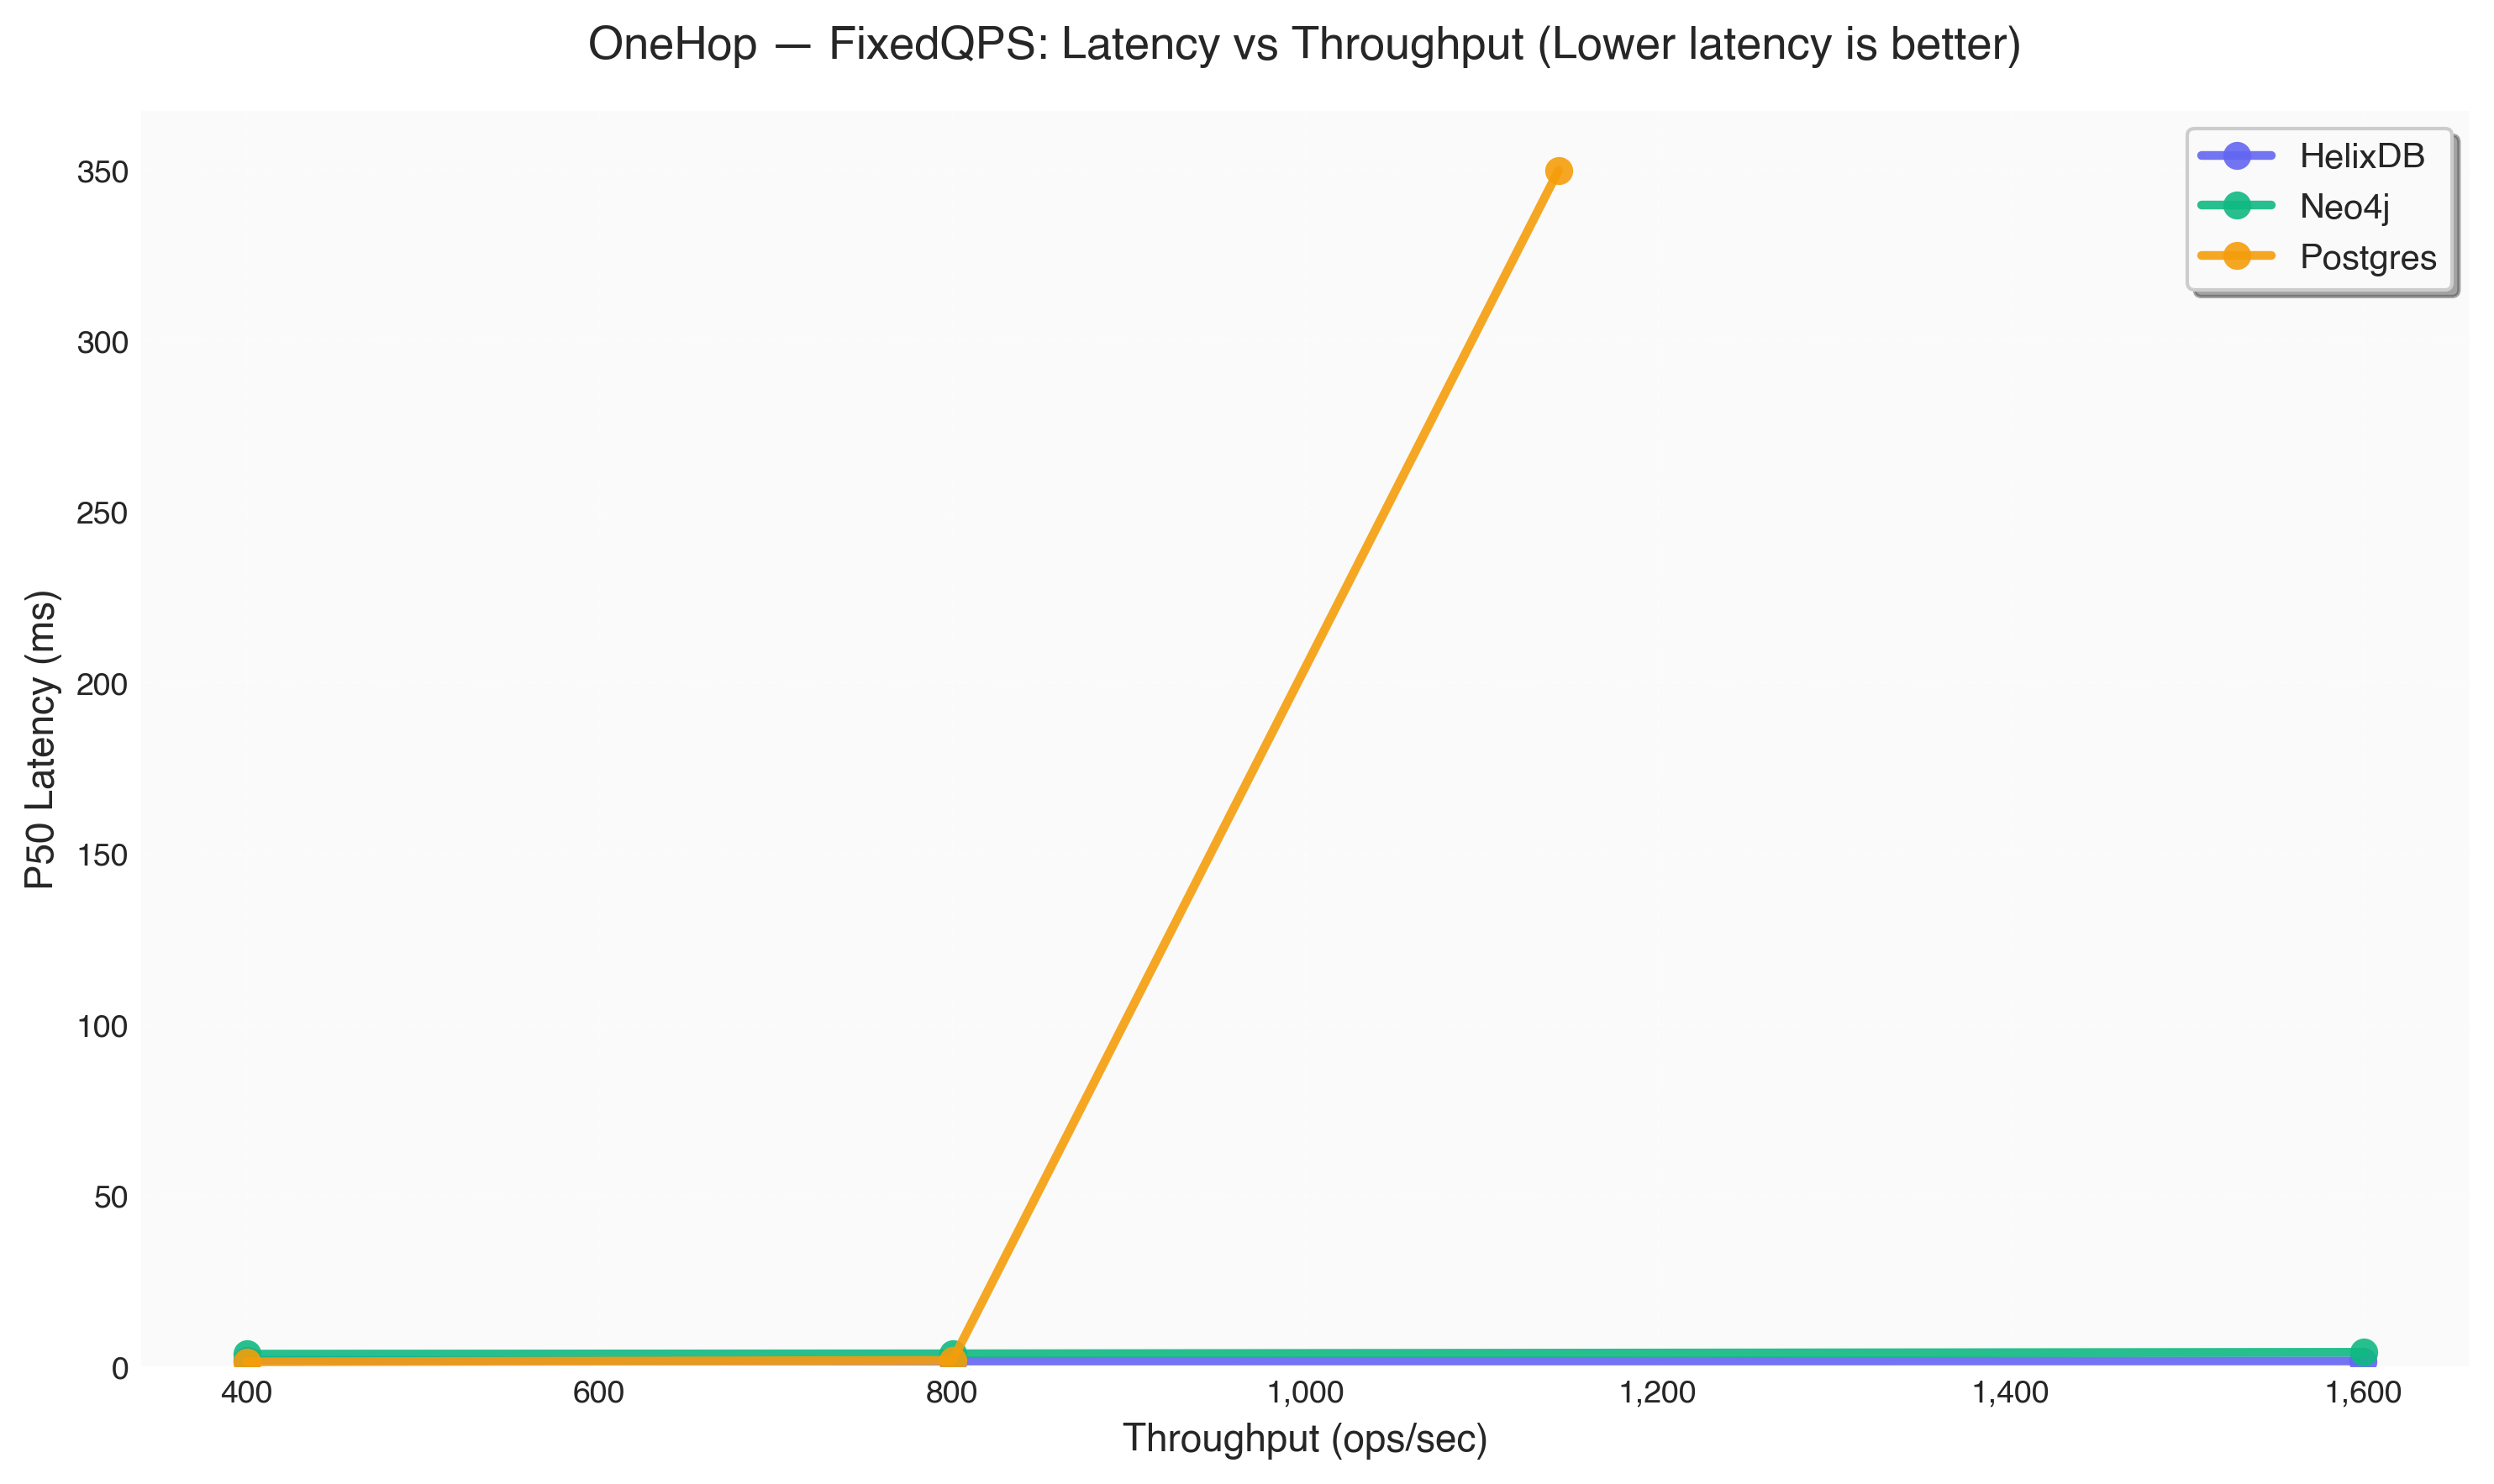
FixedQPS Results
| Database | Target QPS | Actual Throughput (ops/sec) | P50 Latency (ms) | P95 Latency (ms) | P99 Latency (ms) |
|---|
| HelixDB | 400 | 400.2 | 1.70 | 2.51 | 2.65 |
| Neo4j | 400 | 400.2 | 3.52 | 3.97 | 4.09 |
| Postgres | 400 | 400.2 | 1.27 | 1.37 | 1.44 |
| HelixDB | 800 | 800.2 | 1.51 | 2.45 | 2.67 |
| Neo4j | 800 | 800.2 | 3.62 | 4.19 | 4.72 |
| Postgres | 800 | 800.2 | 1.70 | 2.70 | 2.84 |
| HelixDB | 1600 | 1,600.0 | 1.53 | 2.43 | 2.73 |
| Neo4j | 1600 | 1,600.2 | 4.06 | 5.09 | 5.90 |
| Postgres | 1600 | 1,143.8 | 349.81 | 351.85 | 352.76 |
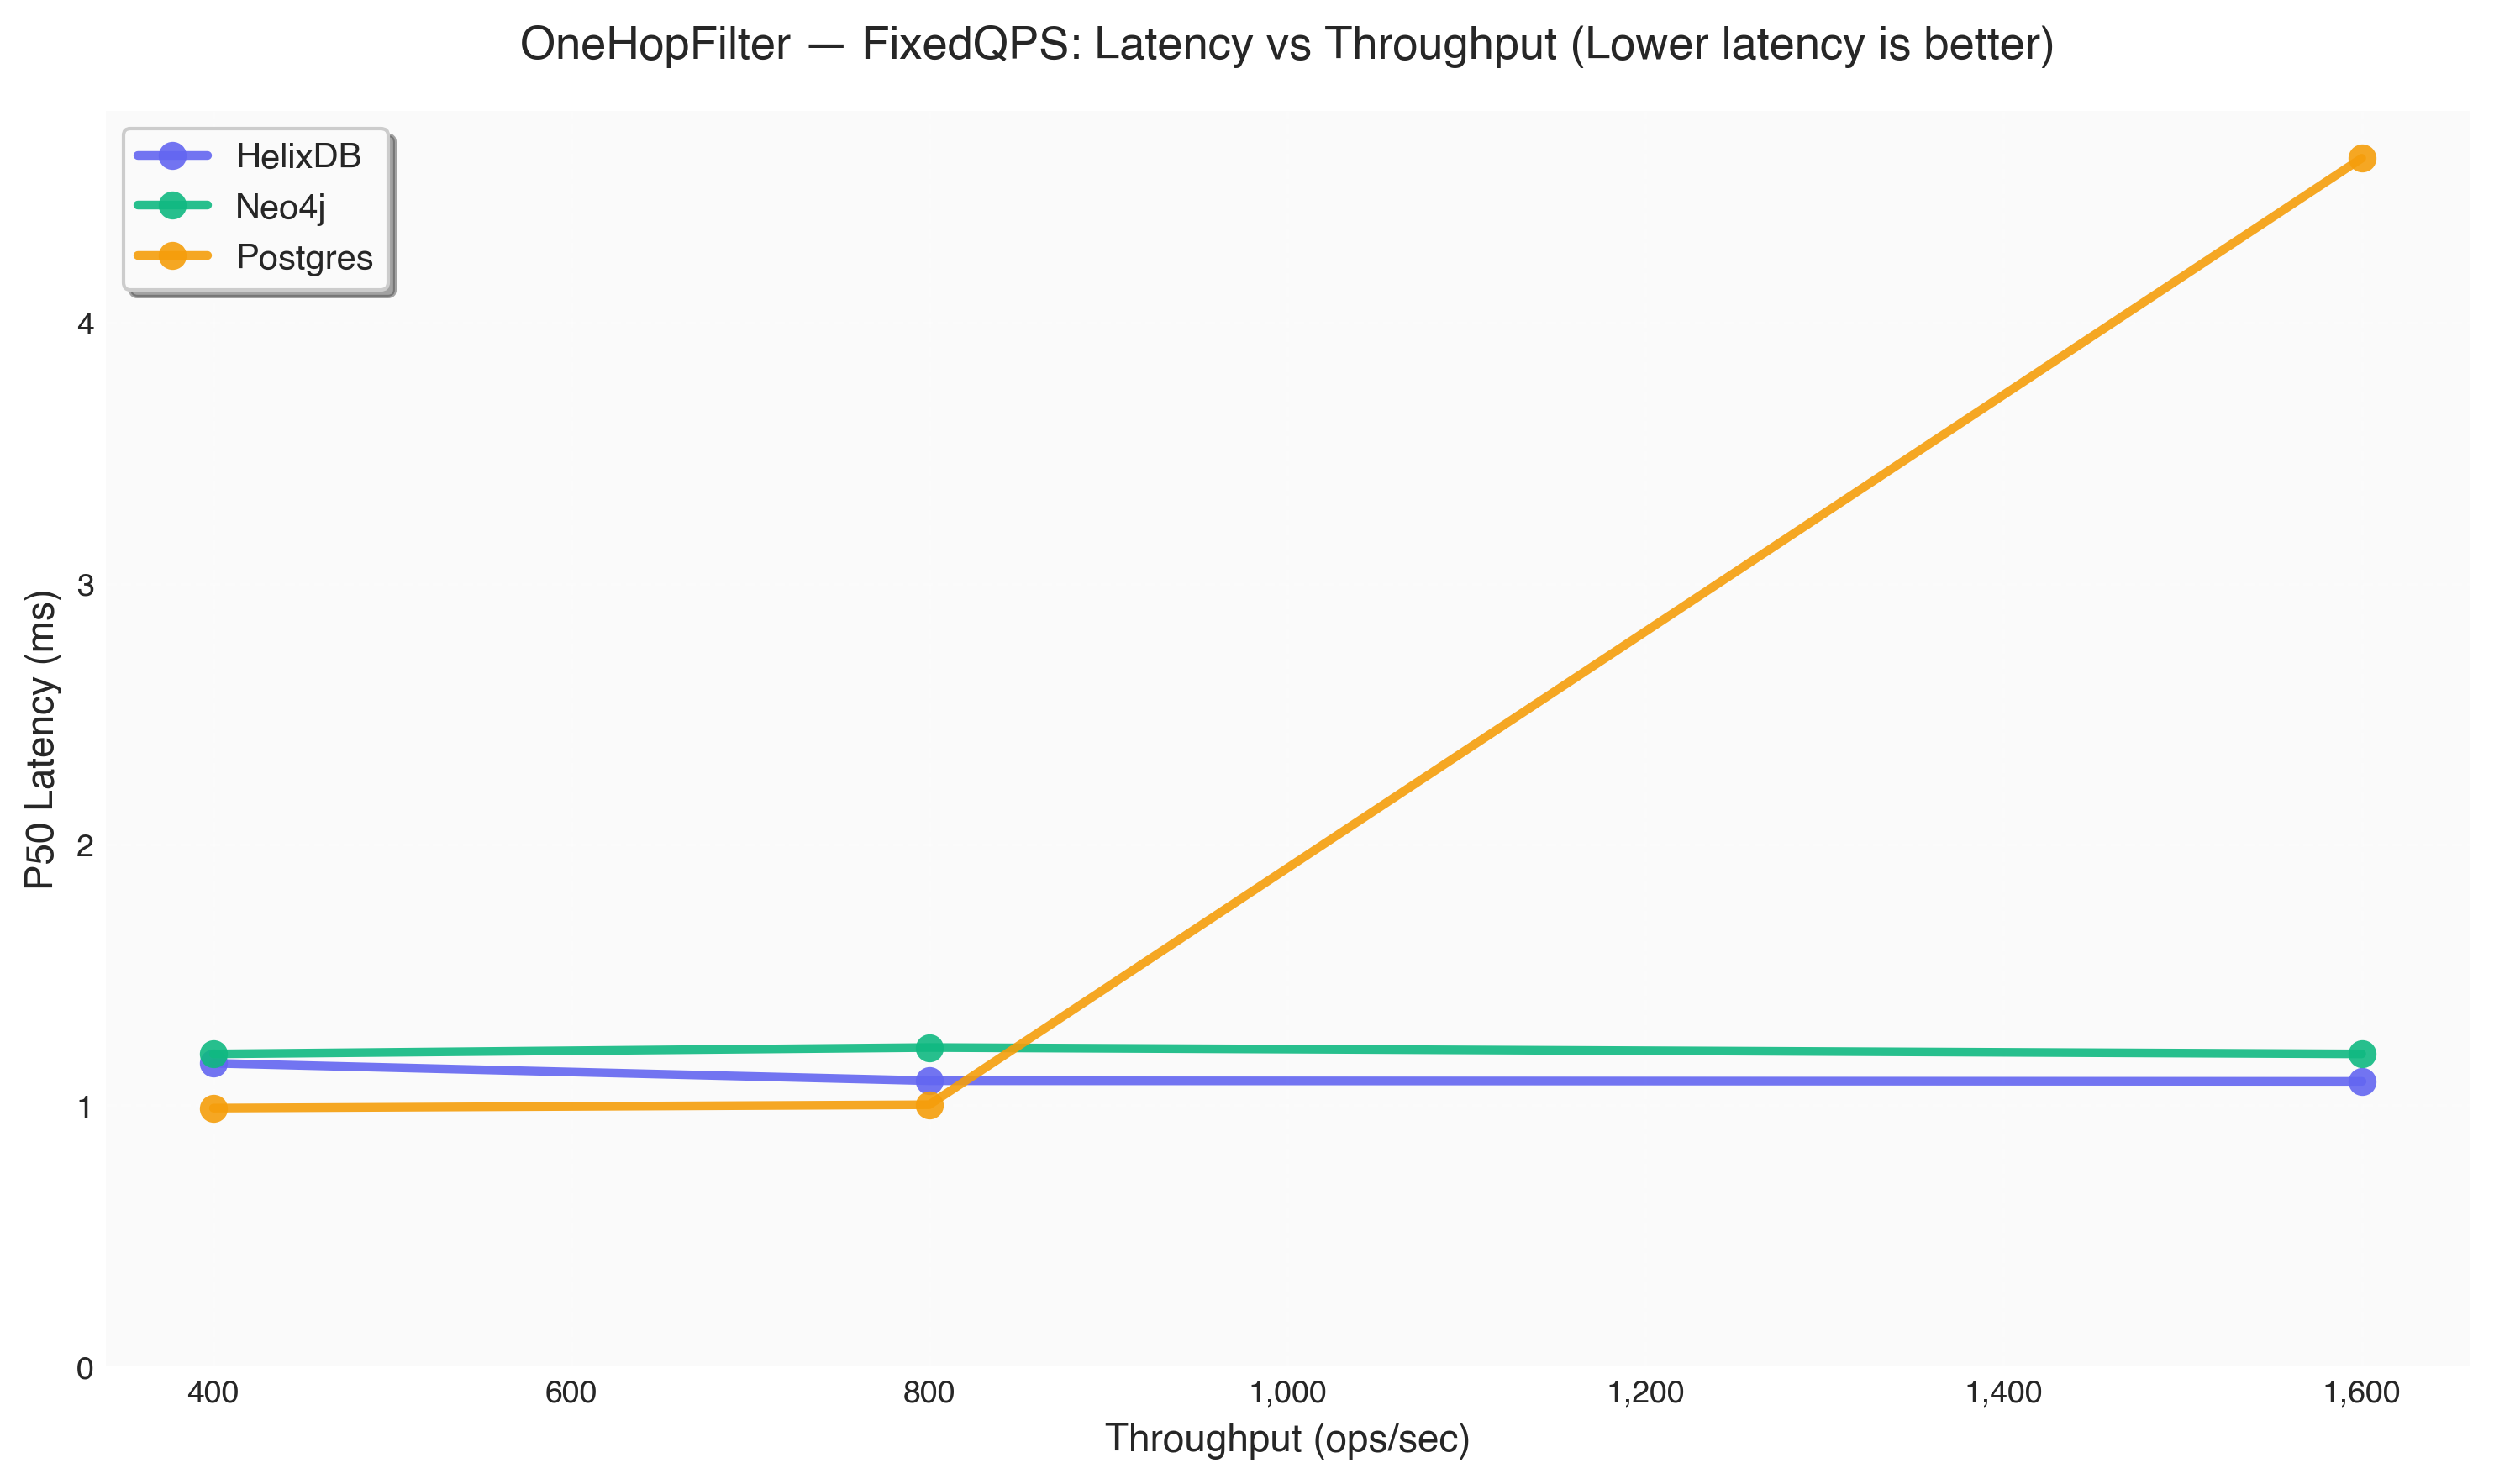
3 · OneHopFilter — Filtered Traversal
Find items a user interacted with in a specific category.
Winner: HelixDB — 4.2x Neo4j, 20x Postgres
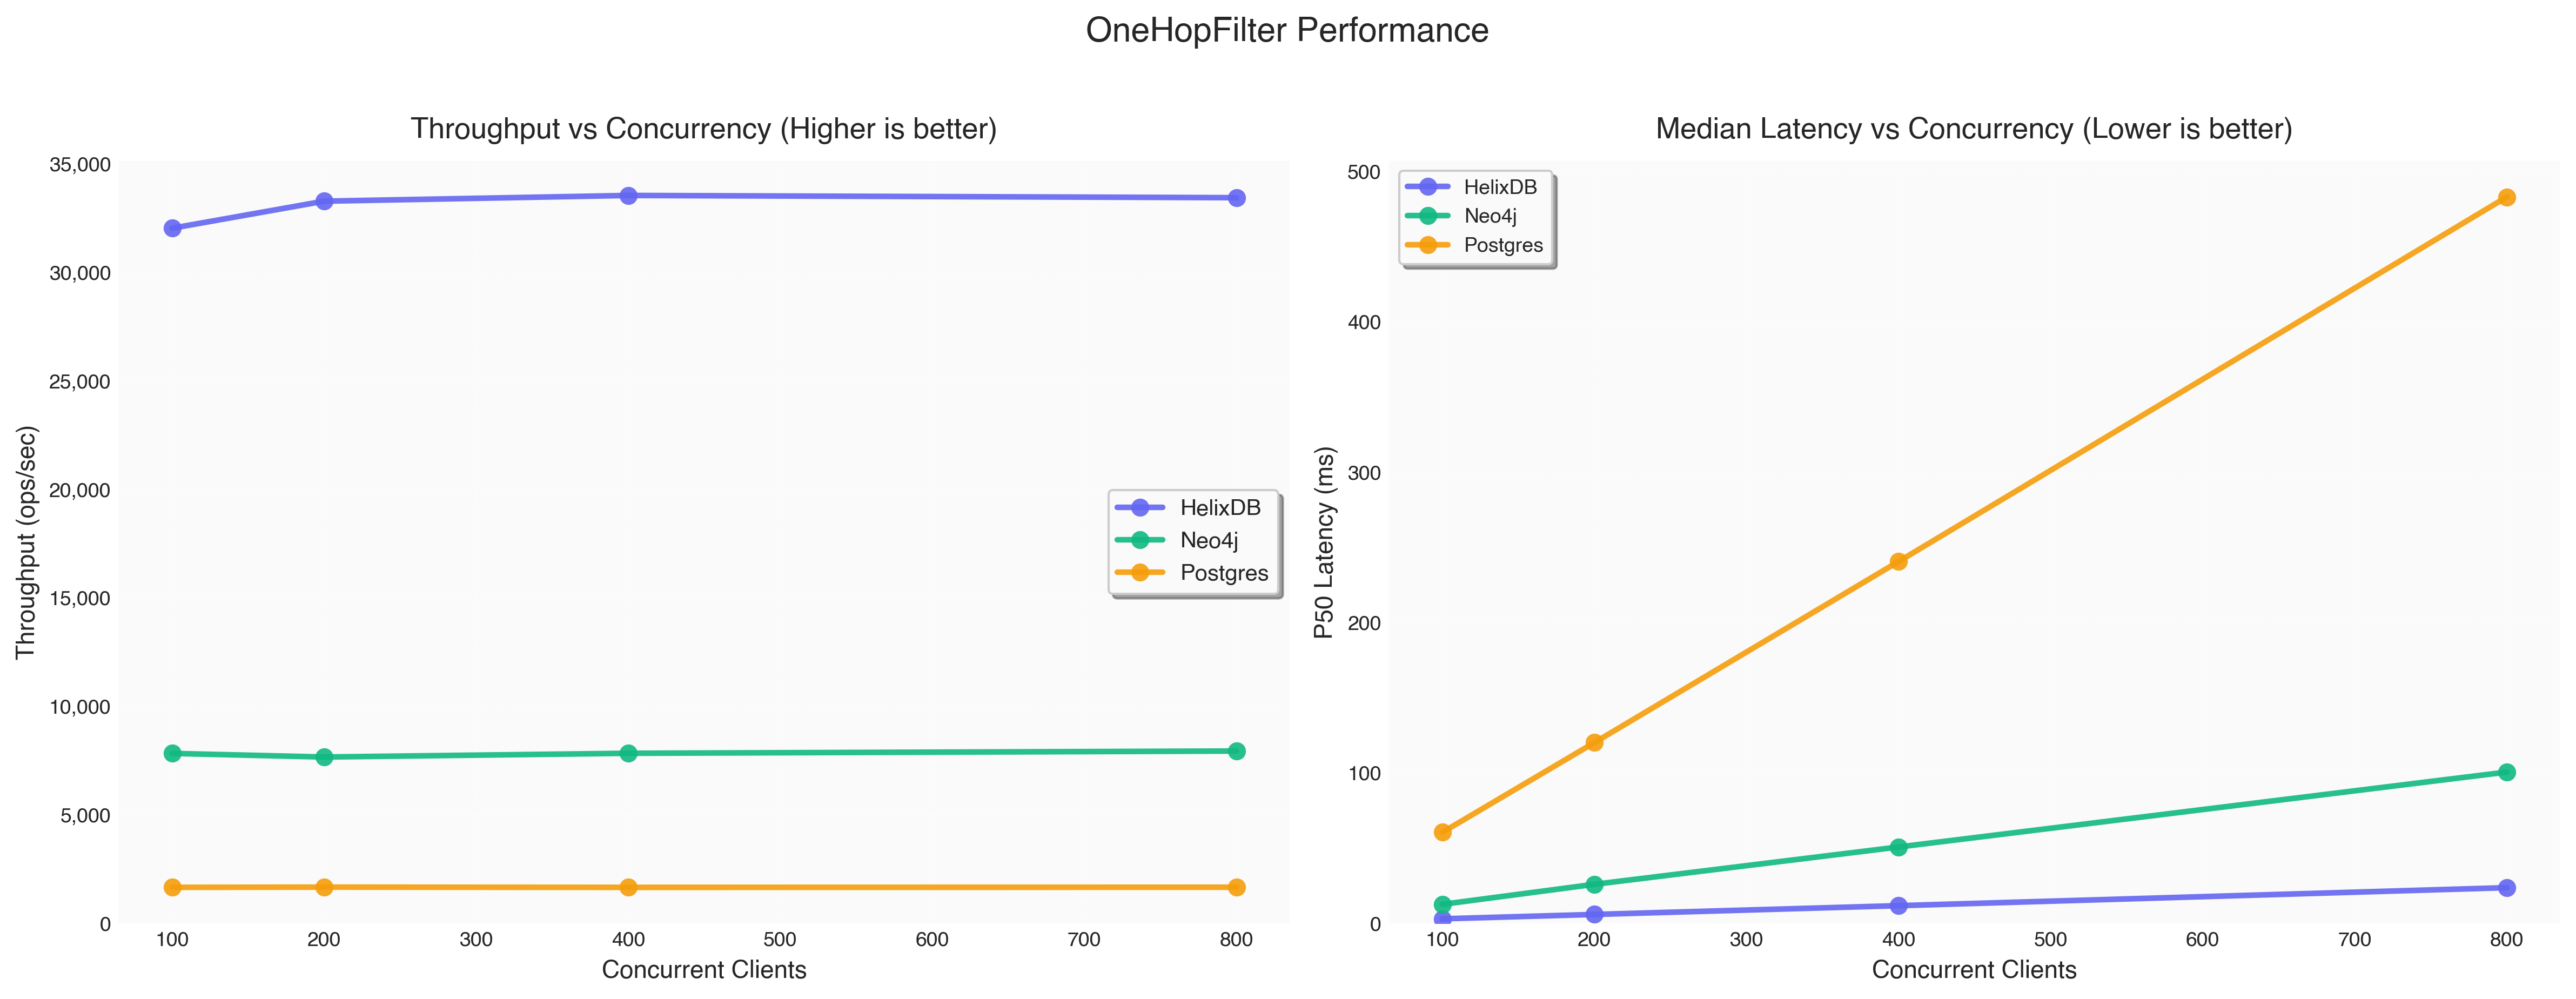
FixedConcurrency Results
| Database | Concurrency | Throughput (ops/sec) | P50 Latency (ms) | P95 Latency (ms) | P99 Latency (ms) |
|---|
| HelixDB | 100 | 32,030.2 | 2.94 | 5.19 | 7.54 |
| Neo4j | 100 | 7,826.0 | 12.56 | 14.80 | 16.85 |
| Postgres | 100 | 1,654.4 | 60.44 | 61.32 | 61.61 |
| HelixDB | 200 | 33,277.0 | 5.84 | 8.96 | 12.93 |
| Neo4j | 200 | 7,660.2 | 25.87 | 28.49 | 29.41 |
| Postgres | 200 | 1,663.6 | 120.12 | 121.57 | 122.07 |
| HelixDB | 400 | 33,540.8 | 11.67 | 16.31 | 19.85 |
| Neo4j | 400 | 7,832.0 | 50.68 | 53.65 | 54.84 |
| Postgres | 400 | 1,653.0 | 240.47 | 254.54 | 256.58 |
| HelixDB | 800 | 33,438.6 | 23.64 | 28.32 | 32.03 |
| Neo4j | 800 | 7,935.8 | 100.48 | 104.09 | 105.07 |
| Postgres | 800 | 1,659.8 | 482.84 | 485.47 | 486.47 |
FixedQPS Results
| Database | Target QPS | Actual Throughput (ops/sec) | P50 Latency (ms) | P95 Latency (ms) | P99 Latency (ms) |
|---|
| HelixDB | 400 | 400.2 | 1.16 | 1.21 | 1.23 |
| Neo4j | 400 | 400.2 | 1.20 | 1.25 | 1.31 |
| Postgres | 400 | 400.2 | 0.99 | 1.13 | 1.31 |
| HelixDB | 800 | 800.2 | 1.09 | 1.15 | 1.19 |
| Neo4j | 800 | 800.0 | 1.22 | 1.28 | 1.32 |
| Postgres | 800 | 800.0 | 1.00 | 1.62 | 1.67 |
| HelixDB | 1600 | 1,600.2 | 1.09 | 1.28 | 1.38 |
| Neo4j | 1600 | 1,600.0 | 1.20 | 1.35 | 1.68 |
| Postgres | 1600 | 1,600.0 | 4.63 | 6.50 | 7.40 |
| Database | Best At | Latency (P50) |
|---|
| HelixDB | Graph operations | 0.9-2.5 ms |
| Neo4j | Graph operations | 2.0-2.1 ms |
| Postgres | SQL | 5-40 ms |
Limitations & Reproducibility
What we didn’t test:
- Cold-start latency
- Insertion times
- Memory footprint during ingestion
- Operational complexity
How to reproduce:
- Dataset hash:
ffed7c34a46dc90e
- Raw JSON results, configs, and benchmark driver in repo
- Tests: November 2025, AWS c6g.2xlarge (eu-west-2)
The Bottom Line
For graph workloads (GraphRAG, Agentic systems, recommendations, social graphs):
-> Use HelixDB. The 5-20x graph advantage dominates in real-world scenarios where traversals are frequent.
Benchmark data + scripts: github.com/helixdb/graph-vector-bench